
Basic description
This report presents four charts showing performance and or comparative results against Credit Unions/Peer Groups for various reporting quarters, and recent trends.
Uses
These charts give a comparative indication as to how a credit union is performing against its peers, using a variety of graphs showing the following ratios:-
• Loan Yield vs Cost of Funds
Yield on Average loans
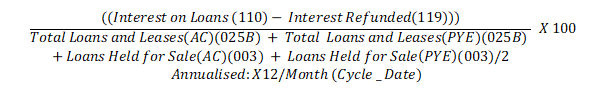
Cost of Funds/Average Assets

• Loan Yield
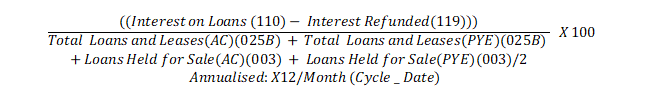
• Cost of Funds

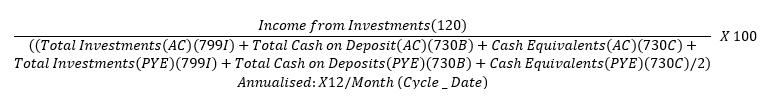
• Investment Yield
Options
You can select:-
- Quarter End Date
- State
- Credit Union
- Peer Group
- Regions
- Asset Ranges
- All Credit Unions - Trend Line - Options are 1, 2 and 3 Year Trends
Comments
0 comments
Please sign in to leave a comment.